주요 서비스 메뉴

Pedestrian Accident Dashboard (DELI-i Global)
Pedestrian Accident Dashboard
- HS Code
- Certification
- Patent
- Awards
- Features
❍ Our pedestrian accident dashboard is a web based mapping frame that displays past pedestrian accident data and geospatial factors around accident spots to diagnose the causes of accidents and predict potential accidents
Product details
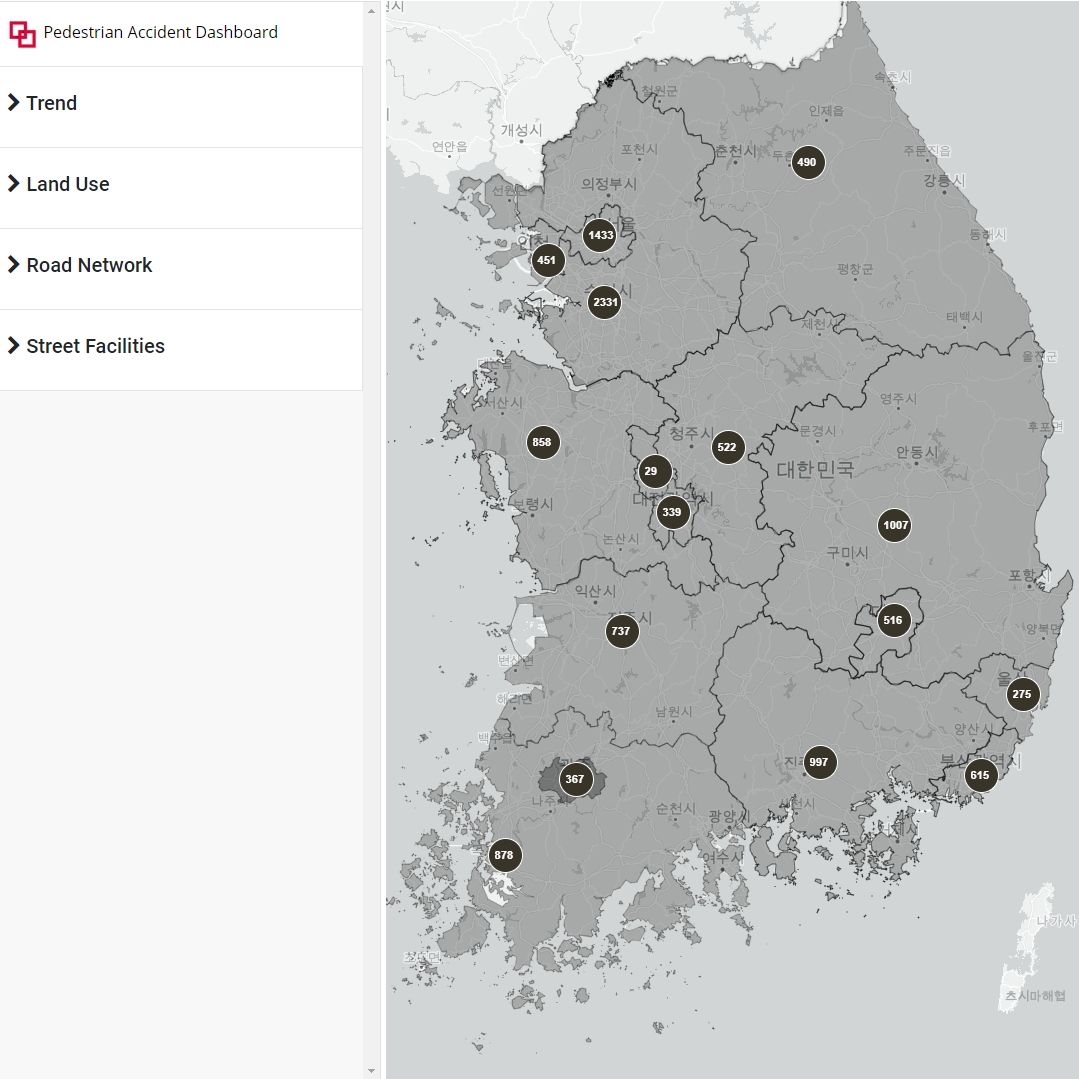
❍ The Pedestrian Accident Dashboard consists of a layer tab on the left and a map on the right with a popup window when an accident point has been selected
❍ There are 5 layers considered to be possible pedestrian accident variables, trend, land use, road network, street facility and topology (planned)
1. Trend
❍ Able to identify the general trend of pedestrian accidents
❍ Yearly (2012-2018), monthly pedestrian accident frequency visualized by graphs
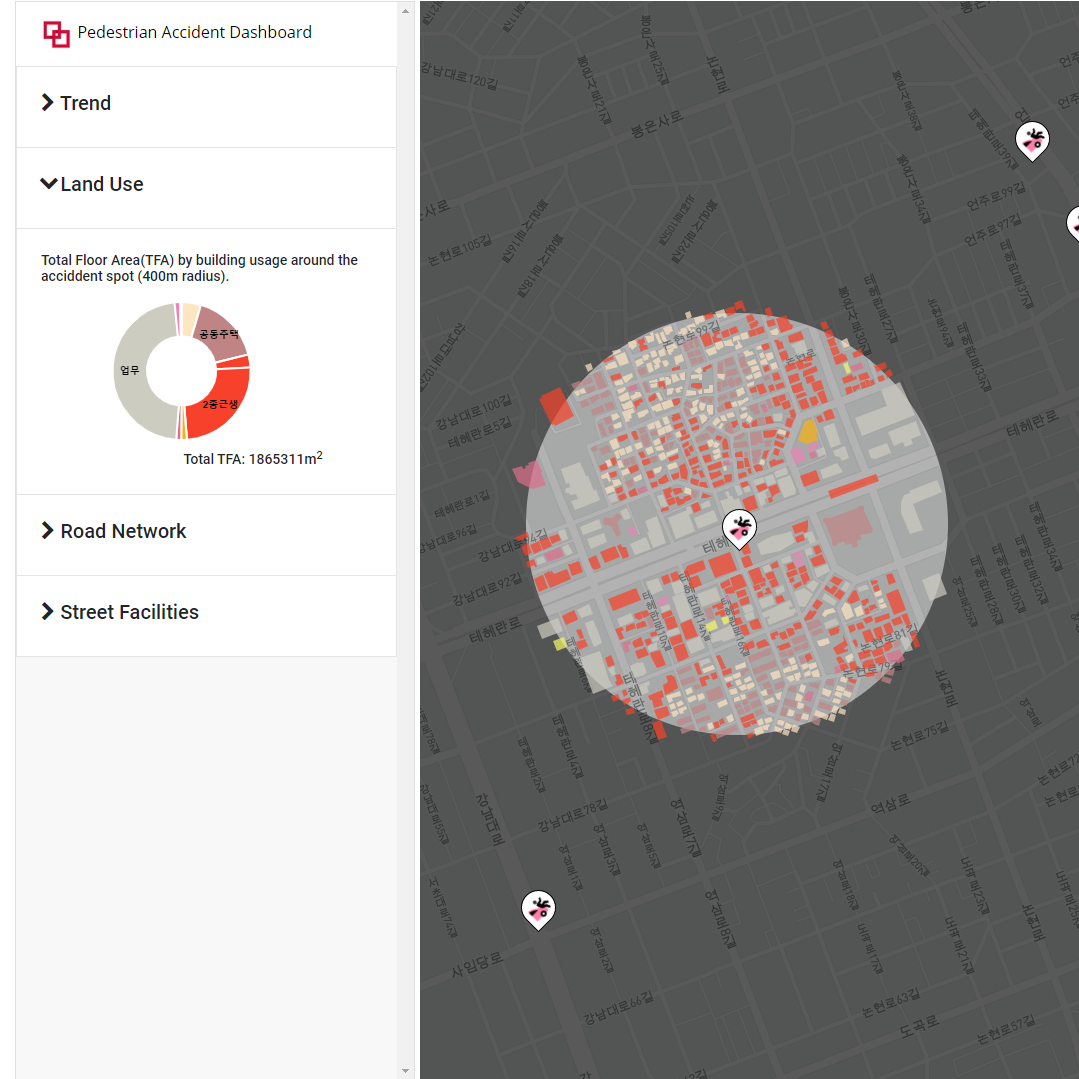
2. Land Use
❍ Buildings within a 400m radius from the pedestrian accident site are categorized using a color scheme
❍ The sum of the Total Floor Area of buildings within a 400m radius from the pedestrian accident site are presented as a donut chart
3. Road Network
❍ The number of intersections and locations within a 400m radius from the pedestrian accident site are visualized
❍ The vehicle accessibility within a 400m radius from the pedestrian accident site are visualized
4. Street Facilities
❍ The number of crosswalks and locations within a 400m radius from the pedestrian accident site are visualized
❍ The area of school zones and locations within a 400m radius from the pedestrian accident site are visualized
※ Mobile Version: Pedestrian Accident Dashboard is also Mobile Compatible
Company Information
Address : 57-2, Heungan-daero 427beon-gil, Dongan-gu, Anyang-si, Gyeonggi-do, Korea
Website : http://http://deliikorea.com
Our company aims to provide IoT devices, products, and services using Samsung Electronics' Galaxy phones, and is trying to maximize the value of use of other used smartphones.
As resource recycling products used through used smartphones, we are proving their value by applying them to the city bus information service, caring service for the developmentally disabled, plastic sorting and discharging device, and air clean circulation system.
Especially. Used smartphones are recycled in the safety industry field and can be used as pedestrian hazards, traffic, crime prevention CCTV, etc., demonstrating the technology.